
DDoS Attack Detection Techniques (Activity Profiling, Sequential Change-Point, Wavelet-Based)

When a network is under attack, it’s not always possible to immediately distinguish between legitimate traffic and malicious data packets.
Because of the high volume of traffic, it’s often impractical to inspect every packet individually, so detection methods focus on traffic patterns and statistics to identify anomalous behavior on a broader, aggregate level.
The tradeoff is that none of these methods are perfect. A legitimate traffic spike, like a news story suddenly sending millions of people to your website at once, can look a lot like an attack. Every detection method has to balance catching real attacks against falsely flagging normal traffic.
Network traffic analysis relies on three distinct methodologies, each designed to catch what the others might miss.
#1 Activity Profiling
Your network has a personality. Over time, you can build a picture of what normal looks like: roughly how many packets arrive per second, where they tend to come from, what ports they use, and what protocols they use.
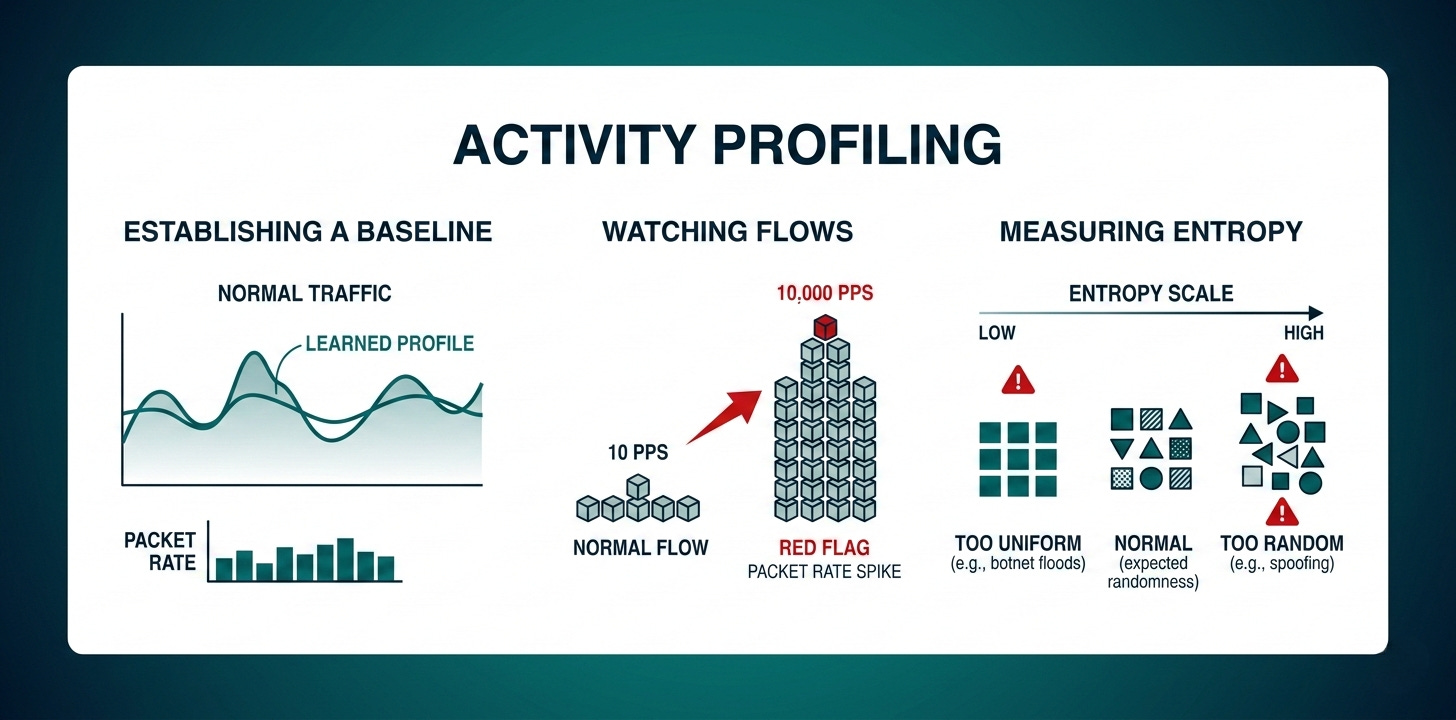
Activity profiling works by continuously comparing current traffic against that learned baseline and asking “is something off?”
Detects: Does this traffic look normal compared to what we usually see?
There are two specific things it watches for:
First, it groups packets into “flows,” which are bunches of packets that share similar header information such as the same source IP, destination port, and protocol.
It watches the average packet rate within each flow. If a flow that normally sends 10 packets per second suddenly sends 10,000, that’s a red flag.
A higher packet rate also means packets are arriving closer and closer together in time, which is another measurable signal.
Second, it measures entropy, which is a measure of randomness or unpredictability in the traffic. Normal traffic has a certain expected level of randomness; it varies, but in familiar ways. Attack traffic tends to break that pattern in one of two directions. A botnet sending floods of identical packets looks too uniform and too low-entropy.
On the other hand, an attacker spoofing random source IP addresses, random ports, and random packet sizes to avoid detection looks too random and too high-entropy. Either extreme is suspicious.
Think of it like a bouncer watching a crowd: if 500 people suddenly arrive all wearing identical outfits, that’s weird. But if 500 people arrive each with a completely randomized, implausible-looking ID from a different country, that’s also weird. Both extremes stand out against what normal looks like.
The main practical challenge is volume. You can’t build a profile on every individual packet, so the technique clusters flows with similar characteristics together and analyzes the clusters, which is far more manageable.
#2 Sequential Change-Point Detection
Where activity profiling asks “does this look wrong?”, sequential change-point detection asks a more specific question: “at what precise moment did things change?”
It’s less about identifying what the attack looks like and more about pinpointing the transition point between normal and abnormal.
Detects: Exactly when did traffic go from normal to abnormal?
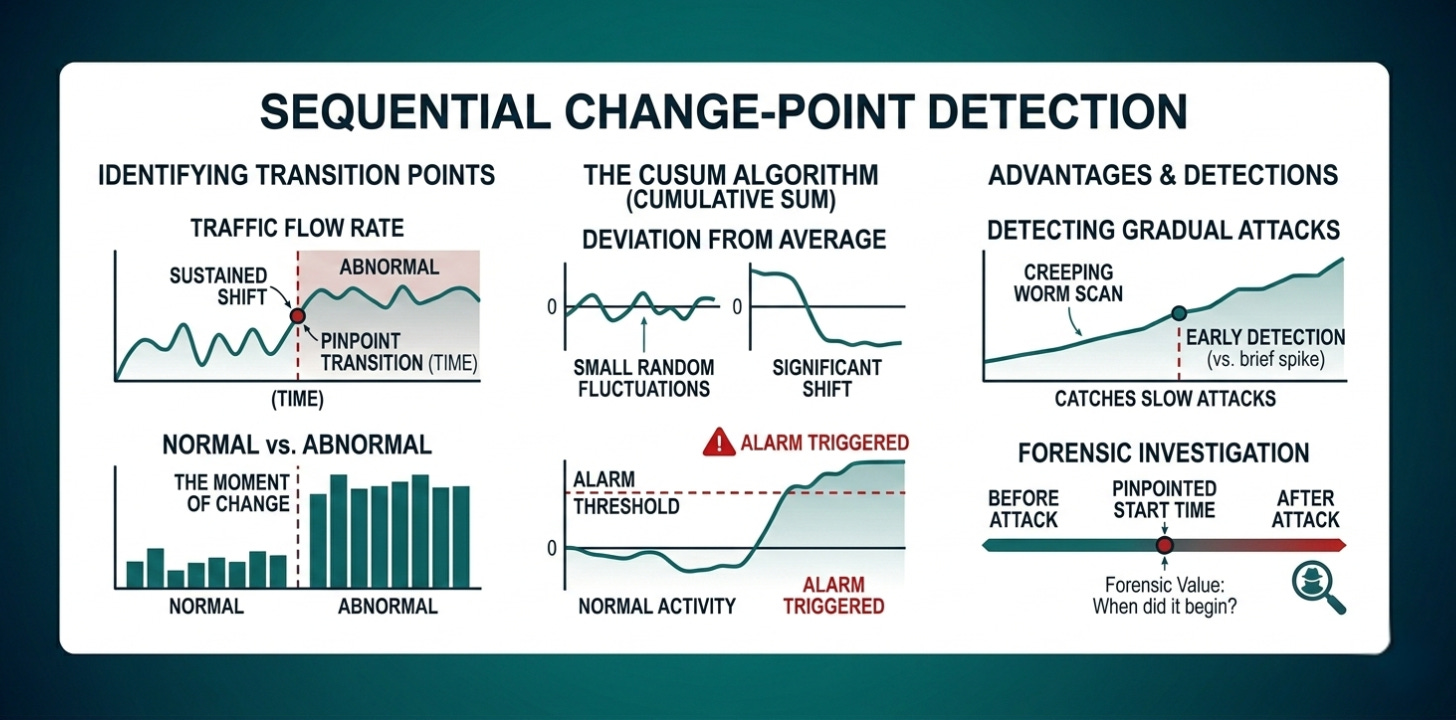
It works by filtering traffic into categories based on IP address, port, and protocol, then plotting traffic flow rate over time on a graph. You end up with a line that goes up and down as traffic fluctuates. The algorithm then watches that line for a sudden, sustained shift, not just a brief spike, but a point where the average genuinely changes and stays changed.
The specific tool it uses is called the CUSUM algorithm, which stands for cumulative sum. Instead of just checking whether traffic is high right now, it keeps a running total of how far current traffic deviates from the expected average.
Small random fluctuations cancel each other out over time and the running total stays near zero. But if traffic shifts significantly and stays shifted, the running total grows until it crosses a threshold and triggers an alarm.
This makes it much better at catching gradual attacks that creep up slowly rather than hitting all at once, which is exactly the behavior of network worms that slowly scan and spread across a network.
It also has forensic value. It can tell you not just that an attack happened, but approximately when it started, which matters when you’re investigating an incident after the fact.
#3 Wavelet-Based Signal Analysis
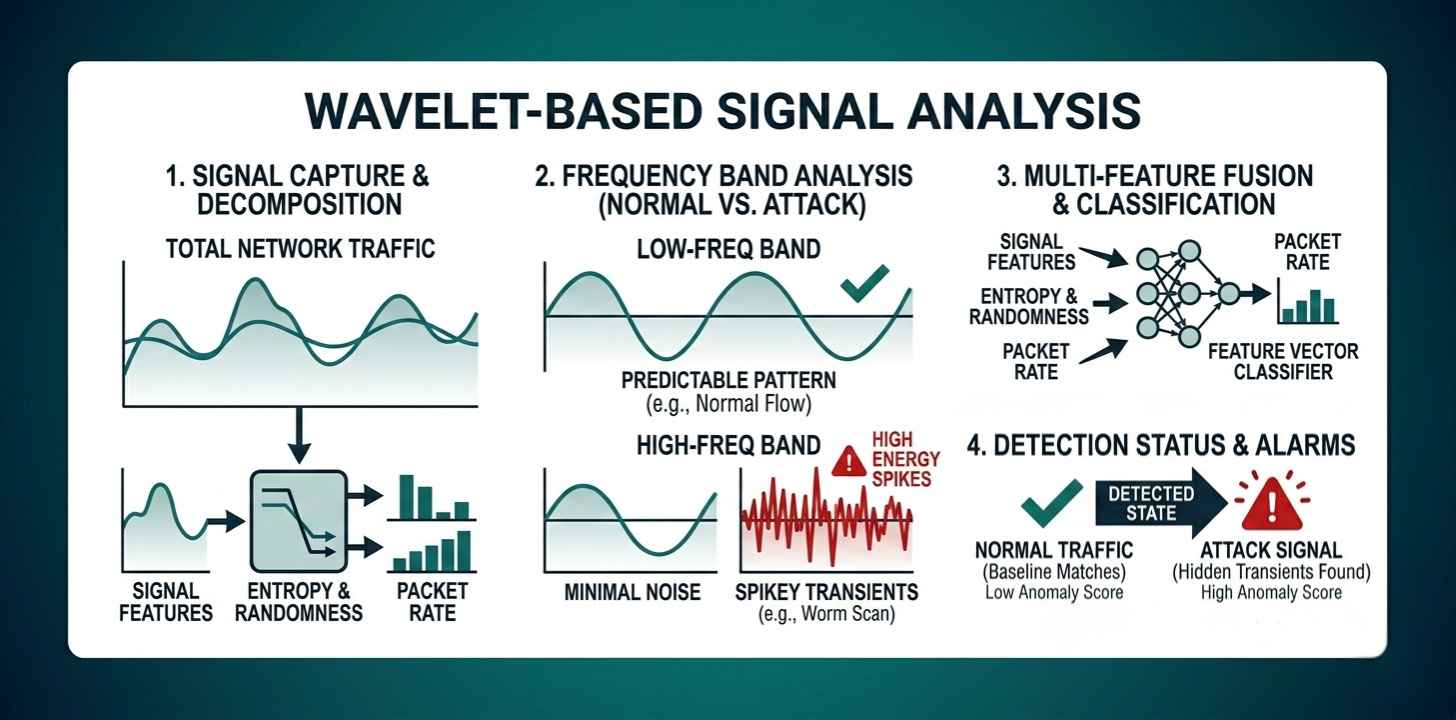
This technique treats network traffic as a signal, similar to an audio signal, and breaks it down into its component frequencies.
Think of a graphic equalizer on a stereo system. A song contains many frequencies at once, including bass, midrange, and treble, and the equalizer separates them so you can see and adjust each one independently.
Detects: Is there an attack signal hidden inside the normal traffic?
Wavelet analysis does the same thing to network traffic, breaking it down into frequency bands and examining how much energy is present in each one.
Normal network traffic is predominantly low-frequency. It flows in relatively steady, predictable patterns over time. Attack traffic introduces high-frequency components, which are rapid, spiky, irregular bursts.
Even when attack traffic is mixed in with normal traffic, those high-frequency spikes stand out in the analysis, the same way you could hear a jackhammer outside even while music is playing inside. The jackhammer occupies a different frequency range and you can isolate it.
The practical advantage of this approach is that it can detect anomalies buried inside otherwise normal-looking traffic, which the other two techniques might miss if the overall volume hasn’t changed dramatically.
Combining the Techniques
Using all three detection methods together gives much better coverage than relying on any one of them alone.
Activity profiling asks whether the overall pattern of traffic looks abnormal compared to a learned baseline. It’s good for catching volumetric attacks and statistically unusual traffic behavior.
Sequential change-point detection asks when exactly things shifted from normal to abnormal. It’s good for catching gradual attacks and for pinpointing when an attack began.
Wavelet analysis asks whether there’s an attack signal hidden inside the traffic that can be isolated by frequency. It’s good for catching subtle attacks that are camouflaged within otherwise normal traffic levels.
Denial of Service Attacks (DoS / DDoS)

Denial of Service (DoS) attacks aim to make a website, application, or network unavailable to legitimate users by overwhelming it with malicious traffic or requests.
great read and explanation here. the activity profiling is a point i’ve seen way to many organizations miss on.